HPGL: Solved Problems Scripts
This document provide set of examples for HPGL scripts on "Solved Problems in Geostatistics" by O. Leuangthong, K.Daniel Khan, and Clayton V. Deutsch book.
2.3. Standartization and Probability Intervals
3.1. Basic Declustering
4.1. Central limit theorem
4.2. Bootstrap and Spatial Bootstrap
4.3. Transfer of Uncertainty
5.2. Variogram Calculation
5.3. Variogram Modeling and Volume Variance
7.2. Conditioning by Kriging
7.3. Gaussian Simulation
8.3. Indicator Simulation for Categorical Data
2.3. Standartization and Probability Intervals
Program output:----------------------------------------------------
Probability interval is: [ 4.16014400549 , 19.8398559945 ]
----------------------------------------------------
Probability interval for standartized normal data is: [ -1.95996399863 , 1.95996399863 ]
----------------------------------------------------
Variance of standartized data in presense of corellation is: 0.154686035265
Probability interval for standartized data in presense of corellation is: [ -7.68516995924 , 7.99454202977 ]
----------------------------------------------------
Variance of data in presense of corellation is: 2.47497656424
Probability interval for data in presense of corellation is: [ -5.36487943027 , 10.3148325587 ]
3.1. Basic Declustering
Program output:
    ---------------------------------------------------

    Original data mean is:  2.28333333333

    Original data variance is:  1.39088301289

    ---------------------------------------------------

    Weights:


    [  993.01065958   373.60679775  1290.24604696   905.17560067   697.2135955

    903.11288741   802.10095283   453.22475511  1002.18336591   432.84271247

    1409.99414493   834.1619253   1358.58995672   453.22475511   823.39636687]

    ---------------------------------------------------

    Weighted data mean is:  1.7969204512

    Weighted data variance is:  1.25755053183

    ---------------------------------------------------
4.1. Central limit theorem
a) Program output:
    ---------------------------------------------------

    One random realization mean is:  0.5501317718

    One random realization var is:  0.121800789196

    ---------------------------------------------------

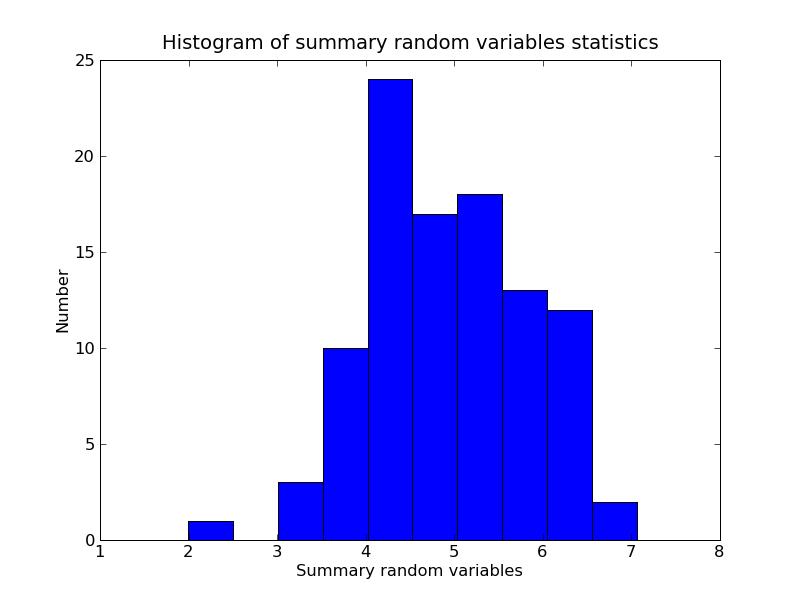
    Summary mean is:  5.03416472703

    Summary variance is: 0.0790254982388

    ---------------------------------------------------
b) Histogram of random variables: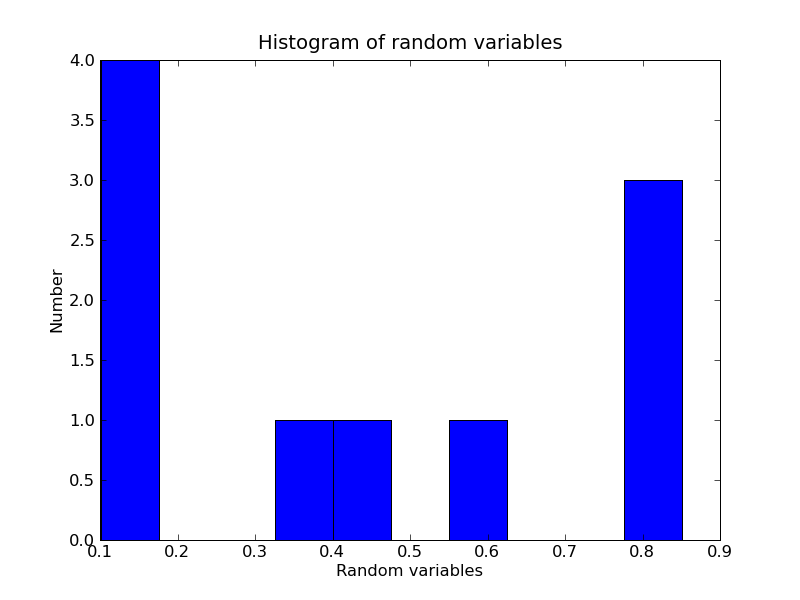
4.2. Bootstrap and Spatial Bootstrap
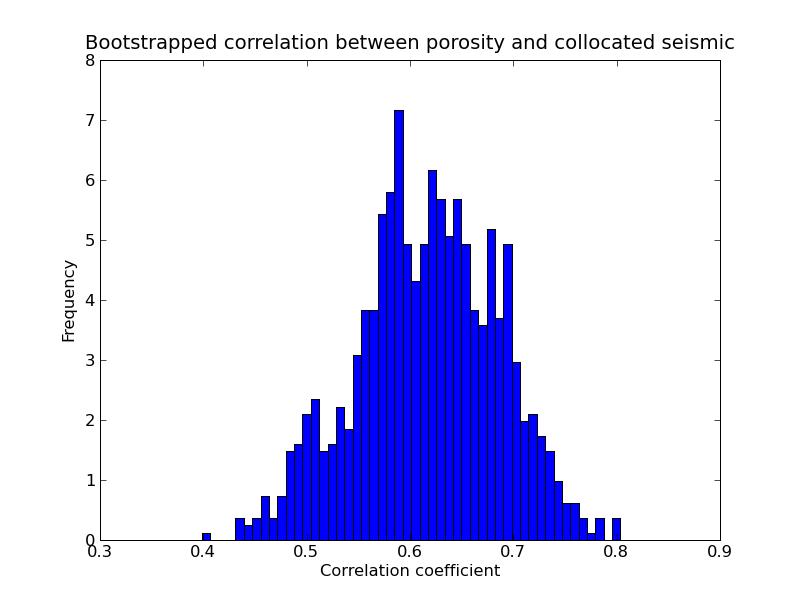
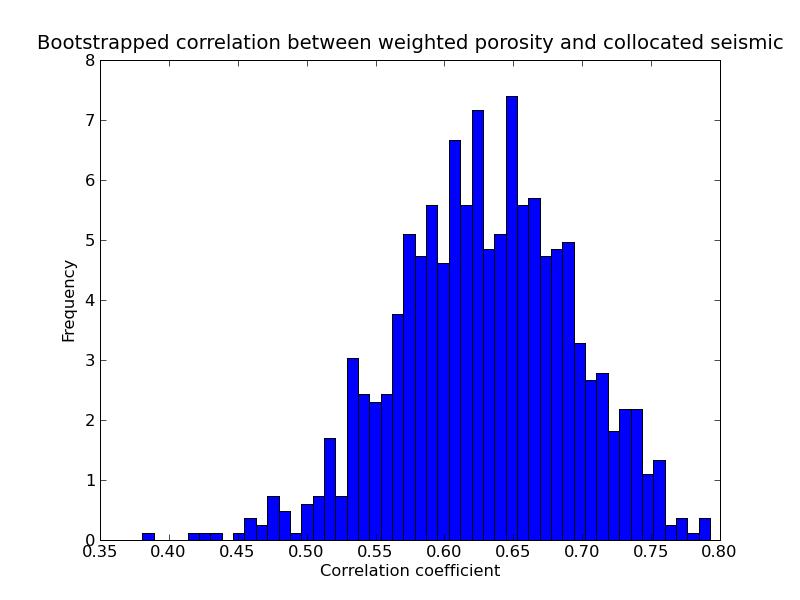
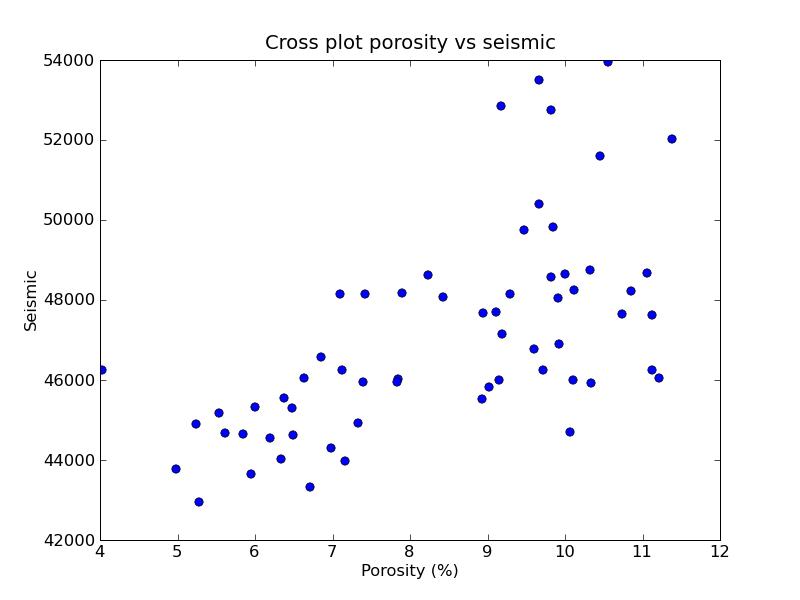
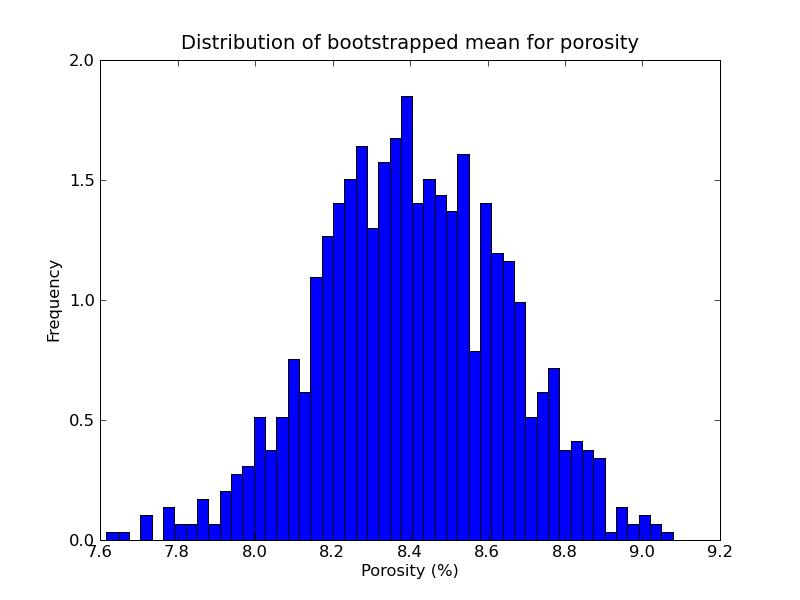
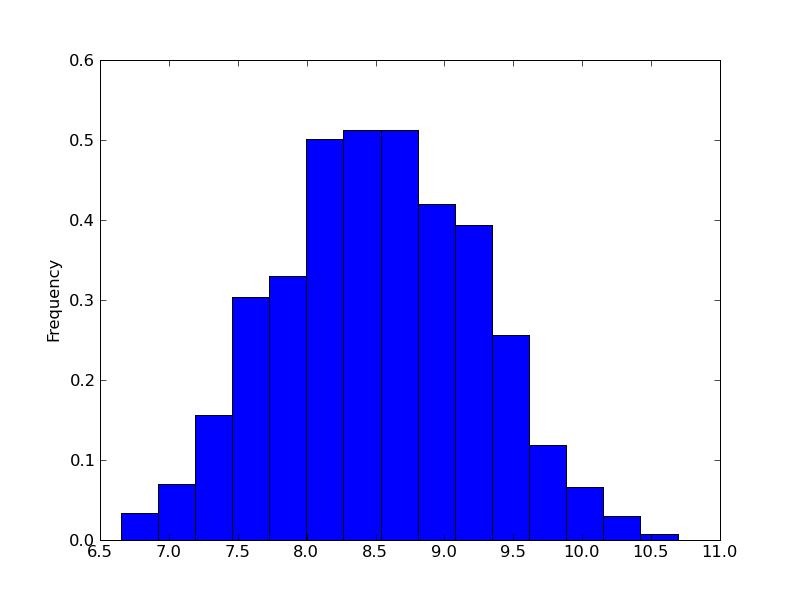
a) Program output:----------------------------------------------------b) Bootstrapped correlation between porosity and collocated seismic:
Porosity mean = 8.40197517019
Porosity mean with cell declustering = 8.20568171395
Porosity variance with cell declustering = 1.85087882609
Difference between means = 0.196293456243
----------------------------------------------------
----------------------------------------------------
Correlation between porosity and seismic: 0.627627936802
Weighted correlation between porosity and seismic: 0.570620708566
----------------------------------------------------
Doing boostrap for poro mean and correlation with seismic data...
Number of random realizations: 1000
Bootstrap calculation completed.
----------------------------------------------------
4.3. Transfer of Uncertainty
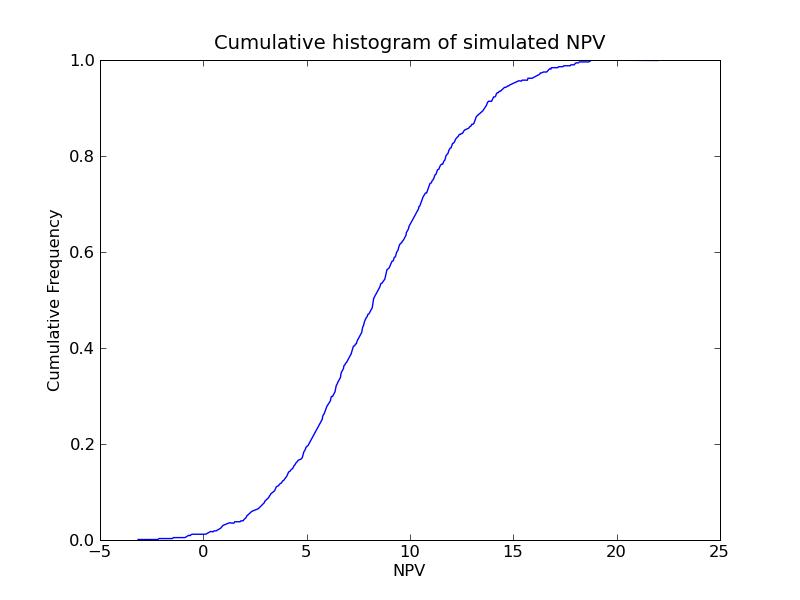
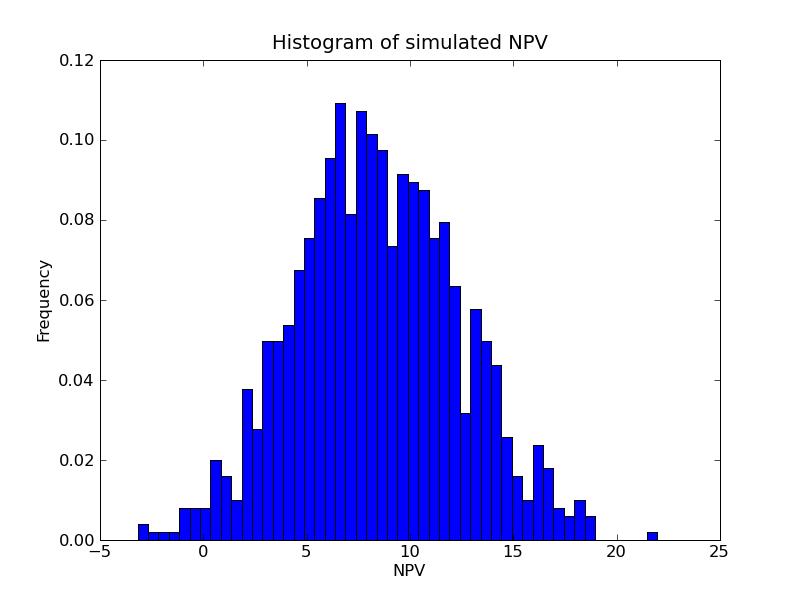
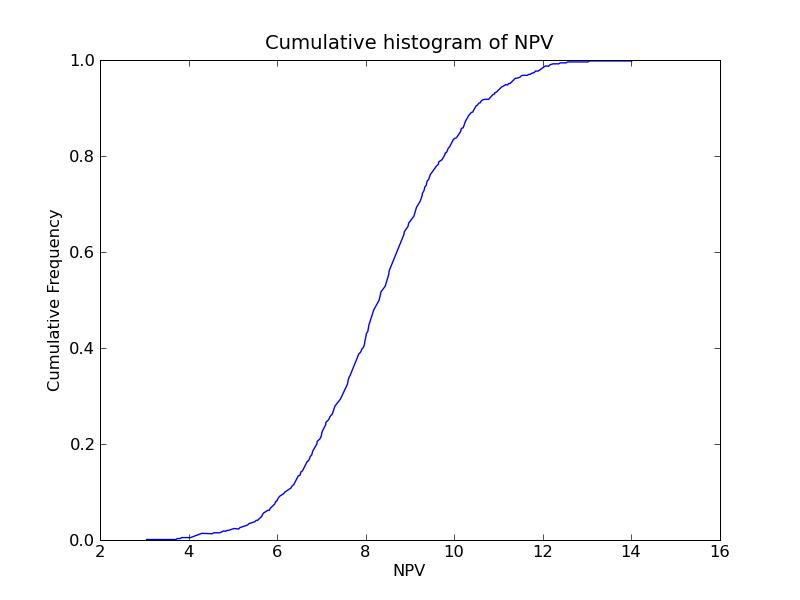
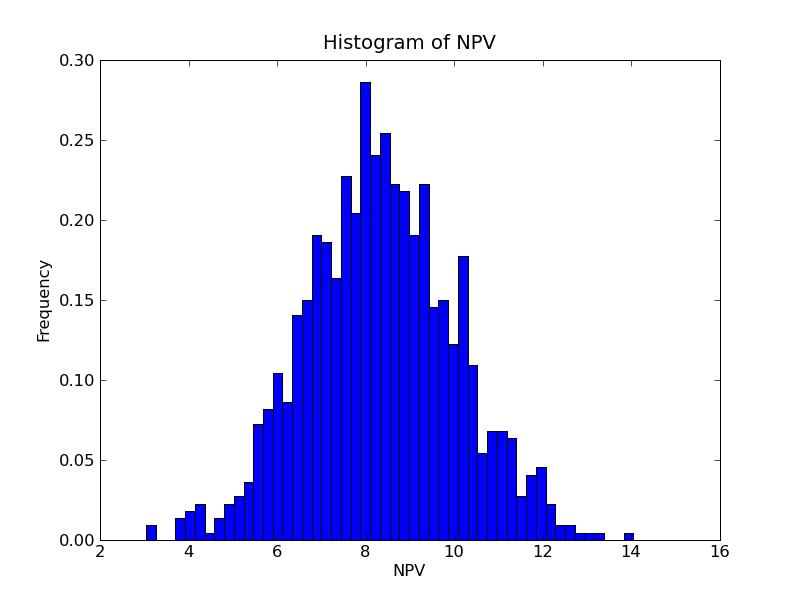
a) Program output:NPVs result:b) Cumulative histogram of simulated NPVs:
-----------------------------
P10 = 3.77887084616
P50 = 8.51502639745
P90 = 13.1389507745
Probability of negative NPV = 0.012
Correlated NPVs result:
-----------------------------
P10 = 6.17564708413
P50 = 8.29905237775
P90 = 10.4664660712
Probability of negative NPV = 0.0
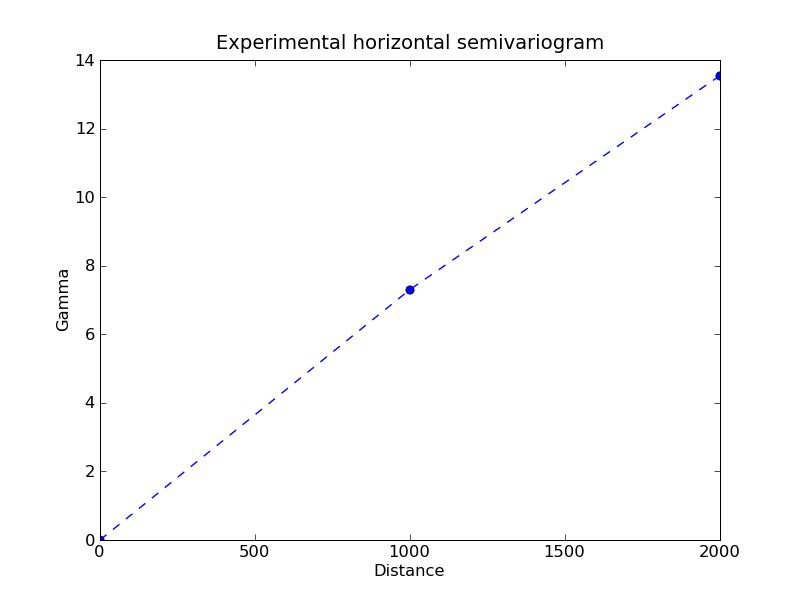
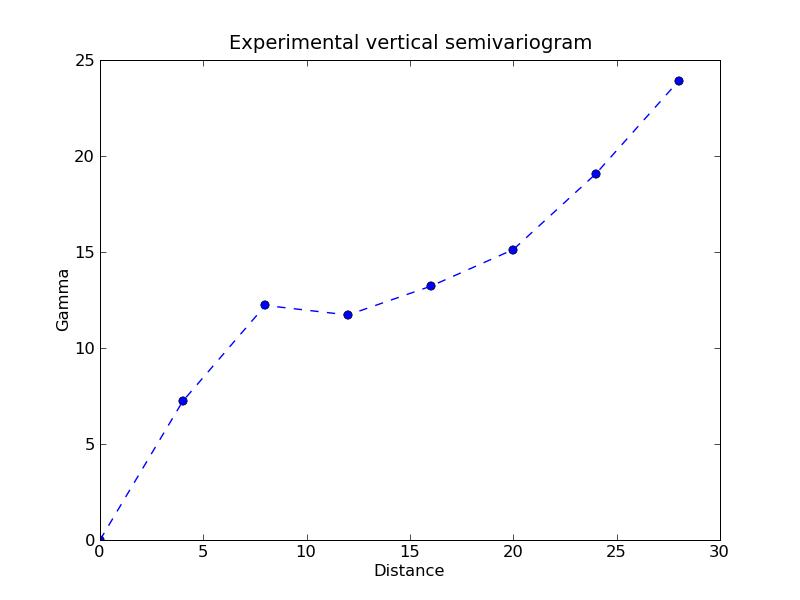
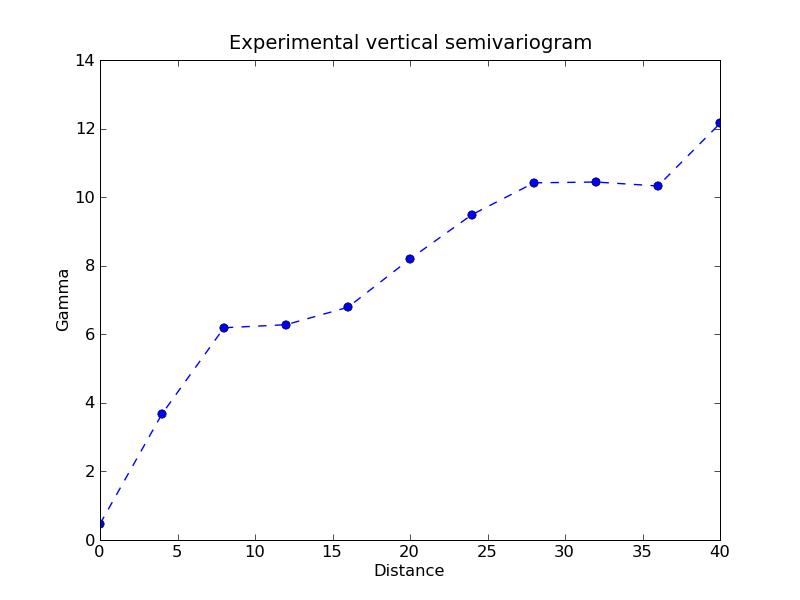
5.2. Variogram Calculation
a) Program output:2D-Vertical semivariogram: [ 0. 7.22204065 12.21773338 11.72054482 13.21637726 15.12846851 19.08102226 23.91016388]b) Experimental horizontal semivariogram:
Horizontal semovariogram: [ 0. 7.3053236 13.54503155]
3D-Vertical Variogram: [ 0.46787289 3.67752957 6.19086933 6.27916288 6.78850794 8.19655132 9.4901104 10.41752148 10.44062805 10.32573032 12.14958477]
5.3. Variogram Modeling and Volume Variance
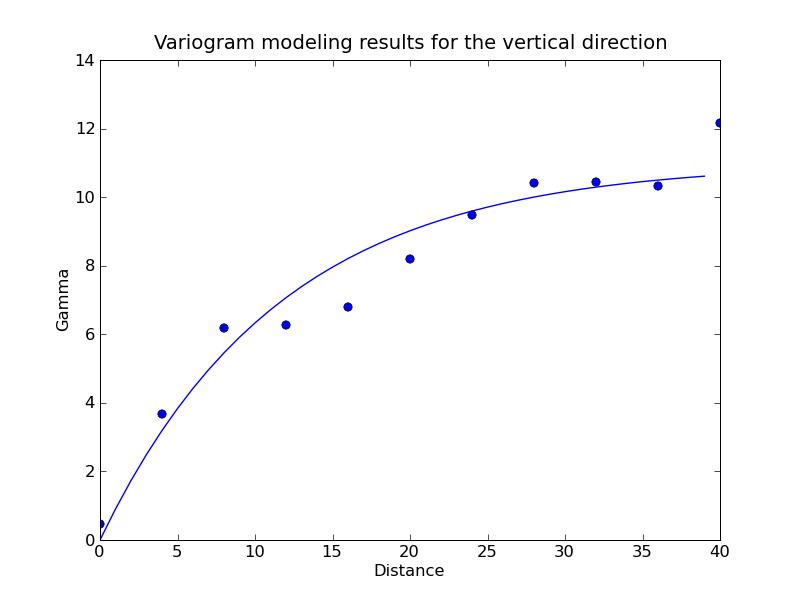
a) Program output:Vertical Variogram:b) Variogram modeling results in vertical direction:
[ 0.46787289 3.67752957 6.19086933 6.27916288 6.78850794
8.19655132 9.4901104 10.41752148 10.44062805 10.32573032
12.14958477]
XLagDistance: [ 0 4 8 12 16 20 24 28 32 36 40]
Gamma for vartical semivariogram: [ 0. 0.90357918 1.73293519 2.49416494 3.19286442
3.83417034 4.4227972 4.96307182 5.45896673 5.91412687
6.33189869 6.71535301 7.06730938 7.39035463 7.6868639
7.95901632 8.20881367 8.43809128 8.64853573 8.84169388
9.01898479 9.18171215 9.33107281 9.46816444 9.59399509
9.70948887 9.81549644 9.91279602 10.00210285 10.08407307
10.15931129 10.22836781 10.29175282 10.34993076 10.40332985
10.45234203 10.49732876 10.53862 10.57651901 10.61130524]
7.2. Conditioning by Kriging
a) Program output:SK result: [-1.22333932 -1.45956635 -1.88999999 -1.20342791 -0.61605299 0.09b) Plots:
-0.42059055 -0.74000001 -1.08000004 -1.01502895 -0.97937196 -0.99411529
-1.01281166 -1.05999994 -1.00405264 -0.97334808 -0.95649707 -0.947249
-0.9421736 -0.93599999]
SGS result: [-1.88999999 -1.0674969 -1.06365824 -1.07050645 -0.74000001 -1.88999999
-0.97683221 -0.92199361 -0.79168916 -0.74000001 -0.75715584 -0.74000001
-0.93187928 -1.17170084 -1.84693933 -1.88999999 -1.88999999 -1.06650364
-0.74000001 -0.74000001]
Simple Kriging result: [-1.13643897 -1.11064959 -1.06365824 -1.27064908 -1.51578677 -1.88999999
-1.36873245 -0.92199361 -0.79168916 -0.96138978 -1.05452347 -1.11227918
-1.14602923 -1.17170084 -1.16994464 -1.16898084 -1.16845179 -1.16816151
-1.16800225 -1.16780841]
Error Field: [ 0.75356102 -0.04315269 0. -0.20014262 -0.77578676 0.
-0.39190024 0. 0. -0.22138977 -0.29736763 -0.37227917
-0.21414995 0. 0.67699468 0.72101915 0.7215482 -0.10165787
-0.42800224 -0.4278084 ]
Cond.Sim: [-0.4697783 -1.50271904 -1.88999999 -1.40357053 -1.39183974 0.09
-0.81249082 -0.74000001 -1.08000004 -1.23641872 -1.2767396 -1.36639452
-1.22696161 -1.05999994 -0.32705796 -0.25232893 -0.23494887 -1.0489068
-1.37017584 -1.36380839]


7.3. Gaussian Simulation
Problem 1:
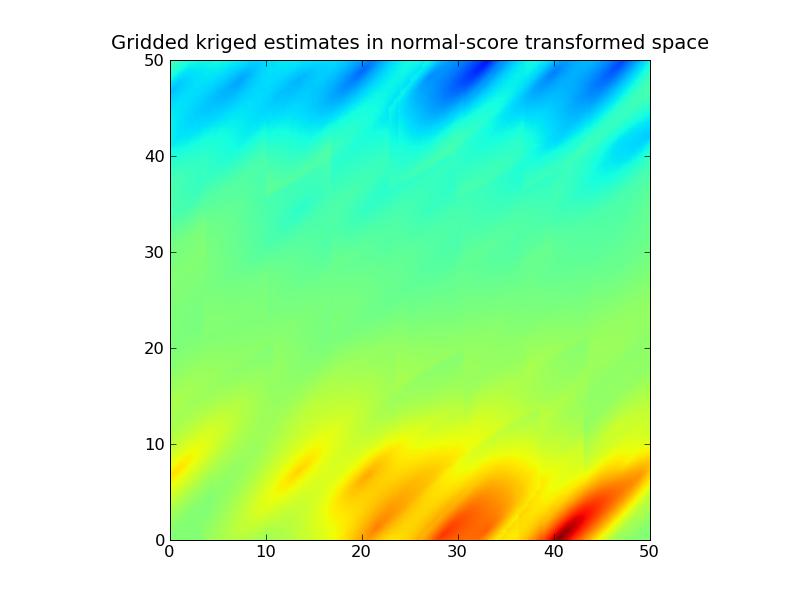
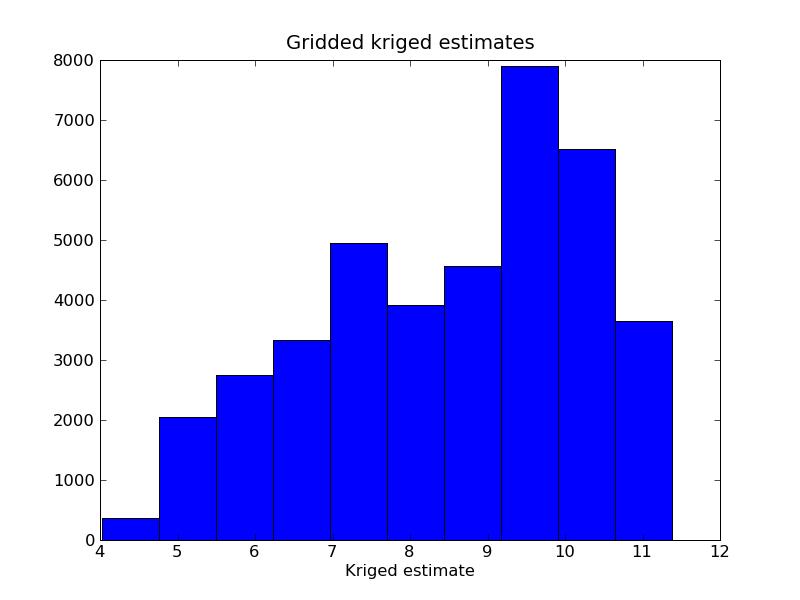
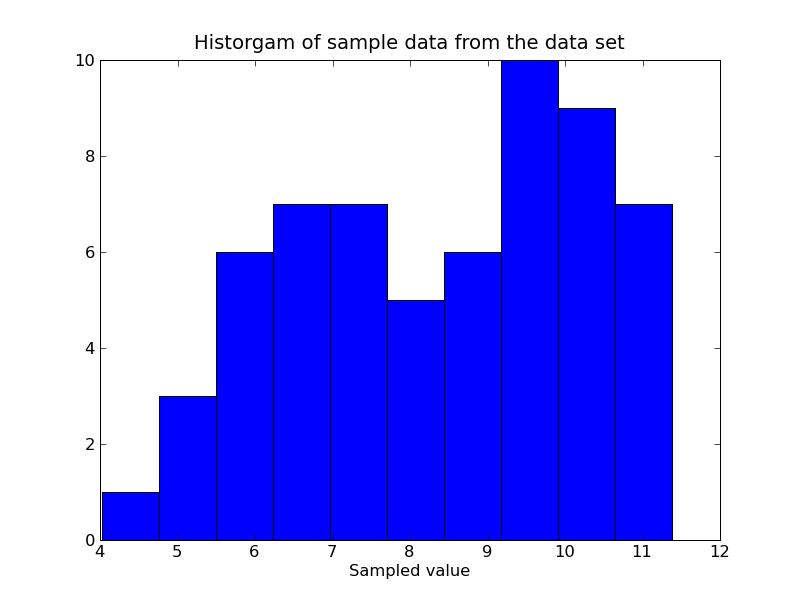
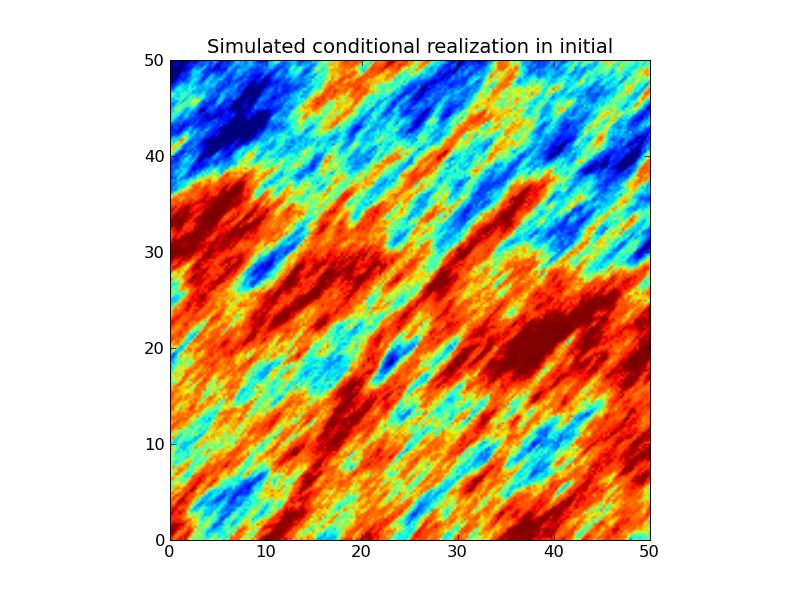
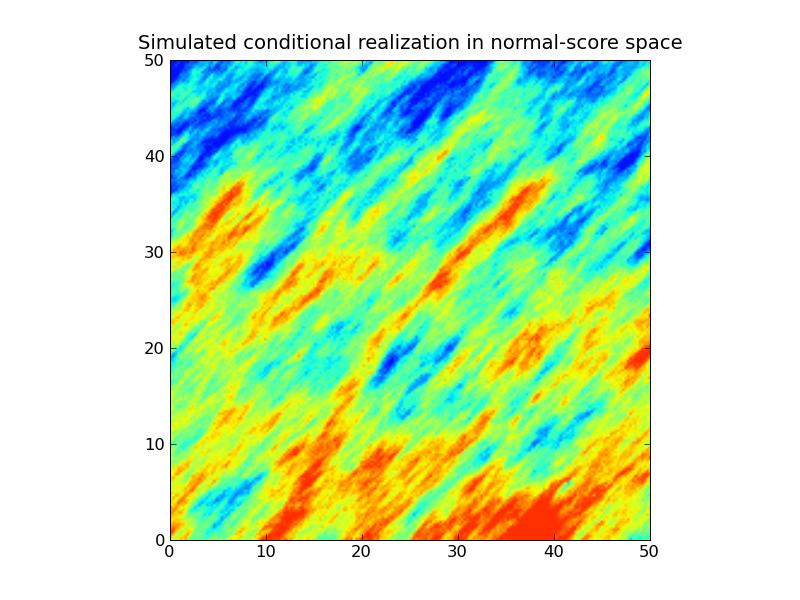
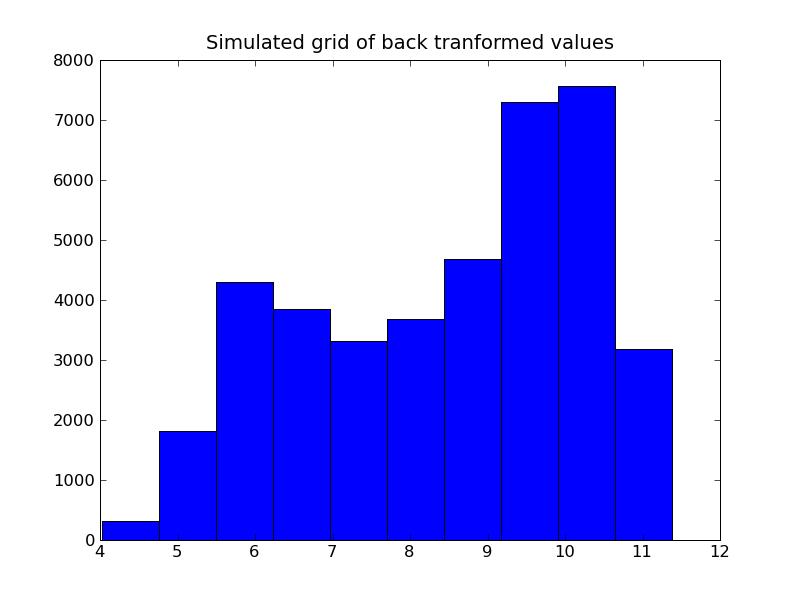
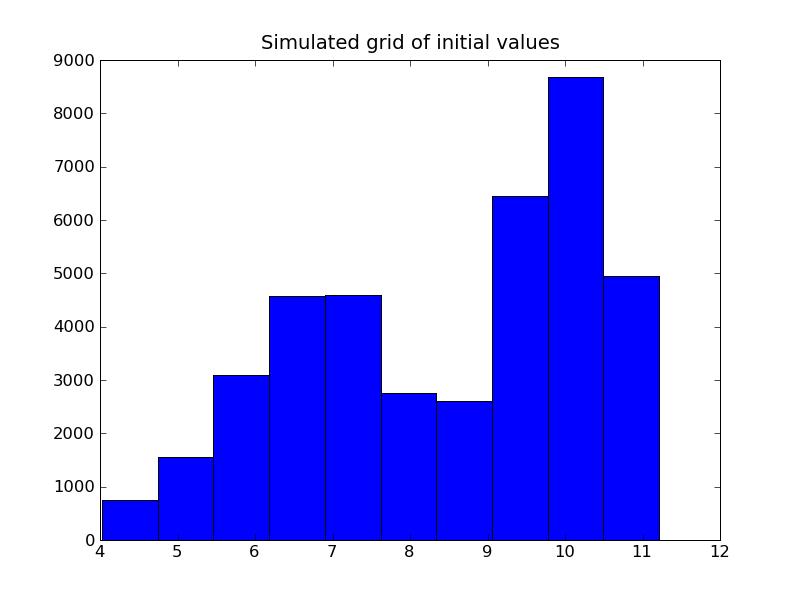
Problem 2:
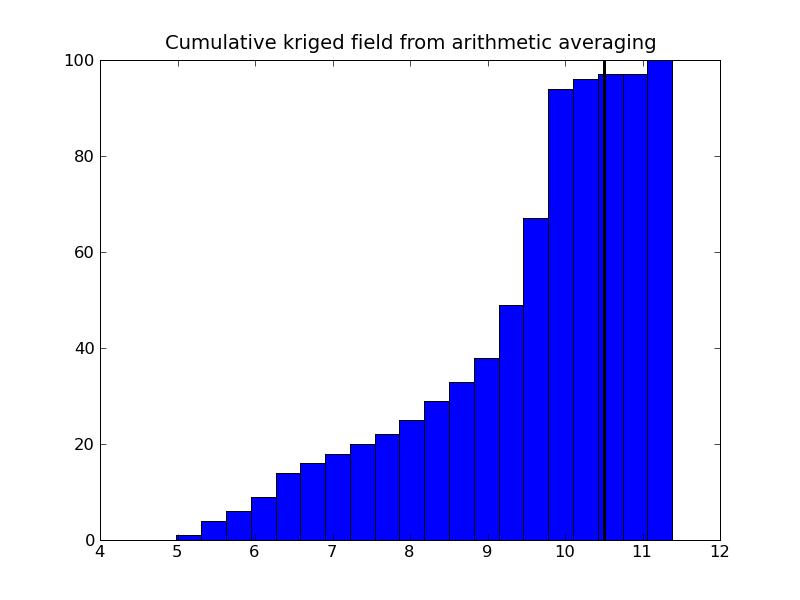
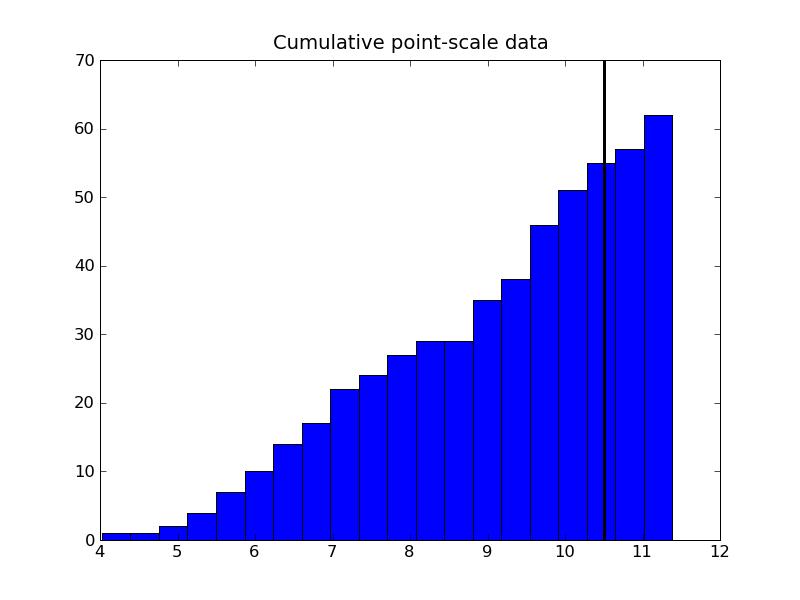
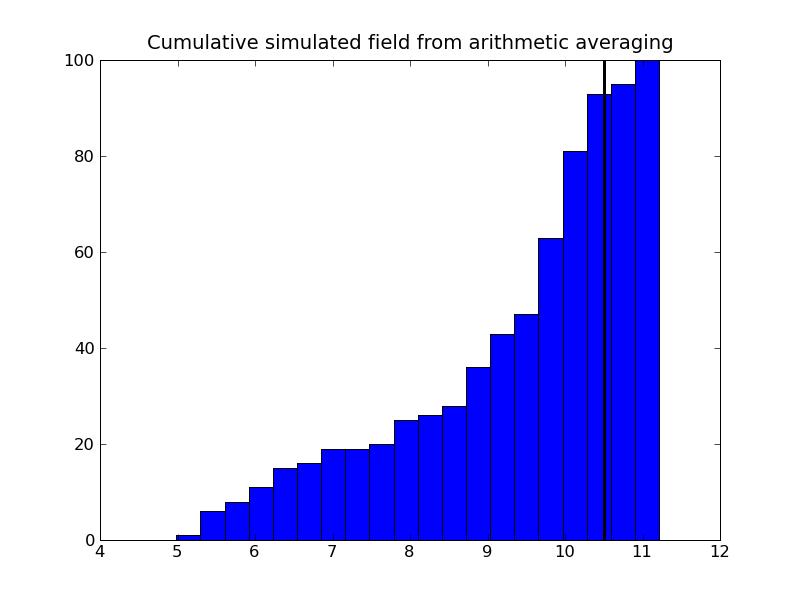
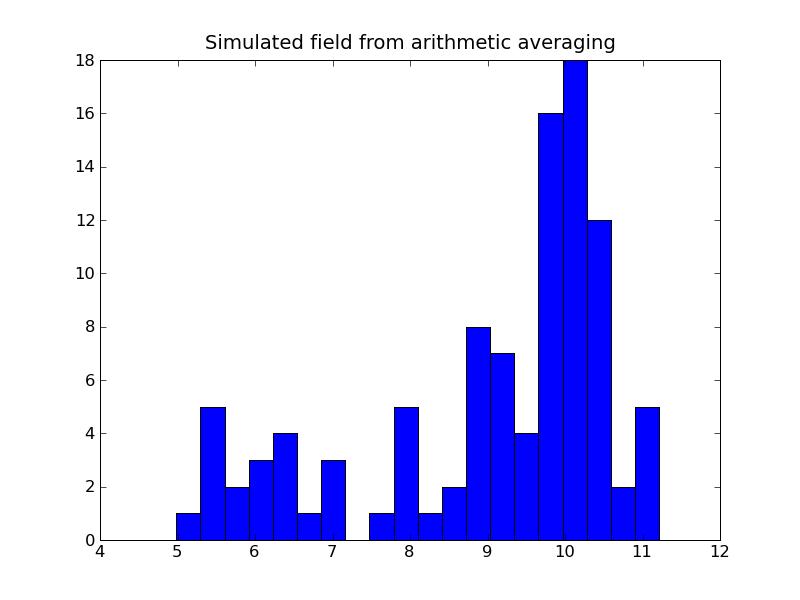
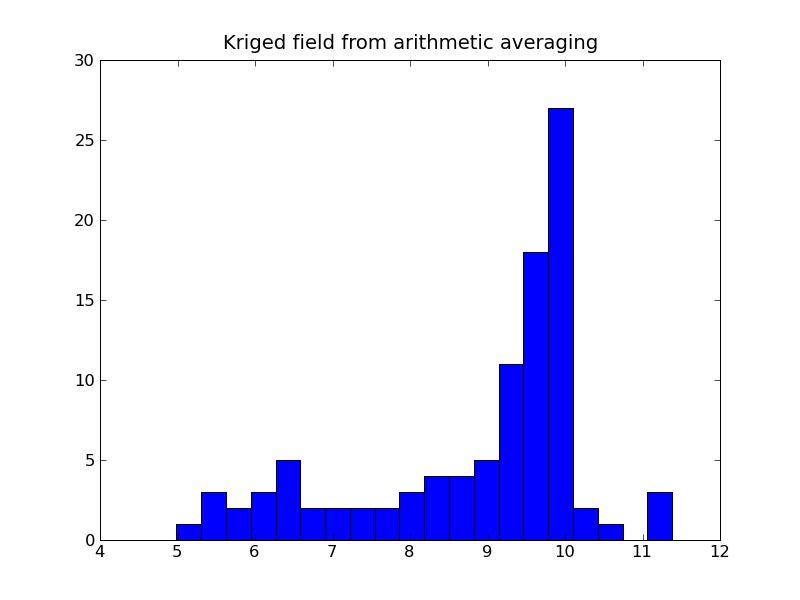
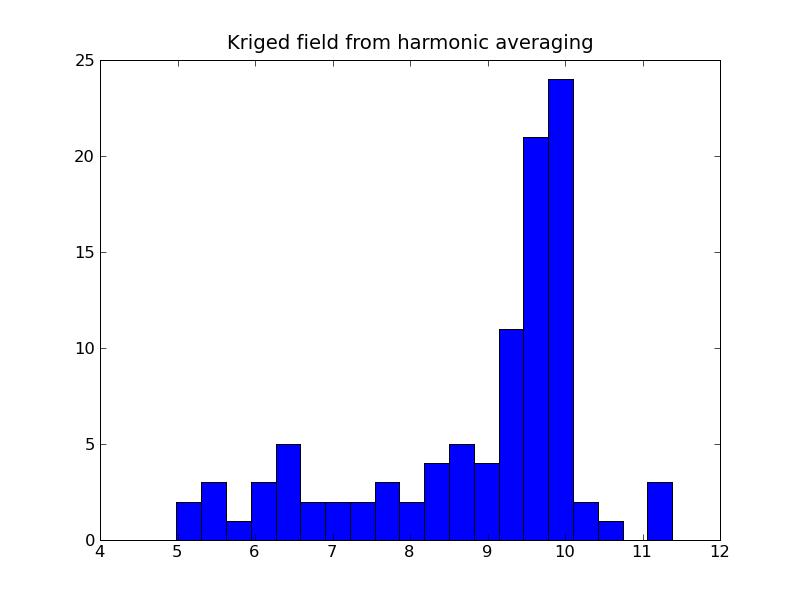
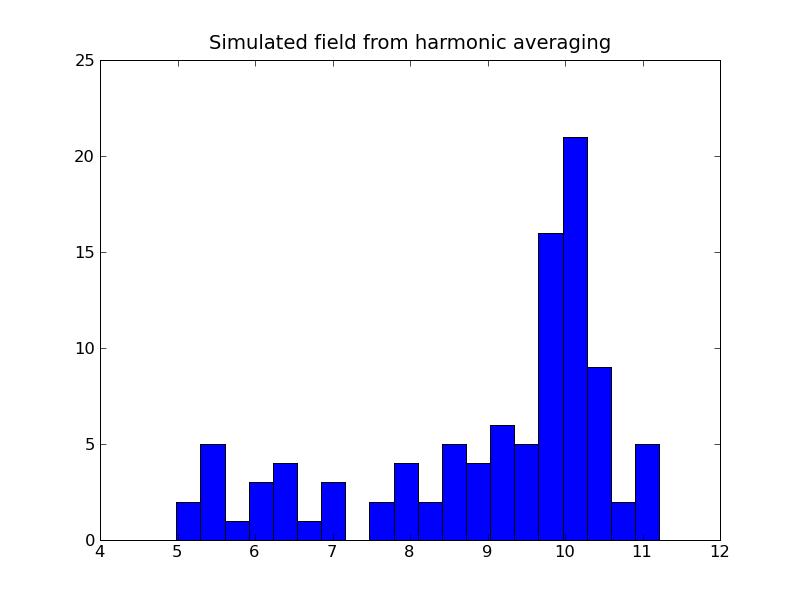
a) Program output:Arithmetic variance: 3.23284634677b) Plots:
Geometric variance: 3.26164002852
Harmonic variance: 3.29291846535
Point scale variance: 3.61991197546
var_back_krigged_transformed_data: 3.82252807617
The diff_variance between point scale and kriged values: -0.202616100712
Sgs on arithmetic data variance: 2.6416104126
The differential variance between point scale and simulated values: 0.978301562862
12.9032258065 % of the data lies above the threshold
4.0 % value of the kriged model falls above the threshold
10.0 % value of the simulated model falls above the threshold
8.3. Indicator Simulation for Categorical Data
